
What is statistics?
Statistics is an essential part of data science. It allows us to understand our data better, discover its properties and decide on the appropriate analysis methods. Without correct data identification, wrong methods may be used, which will render the whole process of analysis useless.
Hypothesis testing is probably the most critical concept in statistics, as it allows data scientists to conclude the population based on the sample data. Don’t worry if you don’t understand these words yet; we will cover them in a minute.
In this article, we will concentrate on hypothesis testing using the p-value. This is a popular method of hypothesis testing, and it is widely used by both statisticians and data scientists. What is a p-value and how to calculate p-value in hypothesis testing – without any further ado, let’s begin!
Introduction
Hypothesis testing and p-value are two essential concepts in statistics. However, they are widely used in data science as well. In particular, hypothesis testing has proved to be helpful in feature selection. It allows us to choose the best variables from the dataset, leaving out the useless ones. P-value, on the other hand, is just a tool used for hypothesis testing. It allows us to make a specific conclusion about the results we received.
Before we go any further, let’s clarify several important statistical terms we will use:
- A population is an entire group of elements we want to study. It could be, for example, all the people in a country, or all the cars produced in a factory.
- A sample is a subset of a population, a representative in research. For instance, if we want to study the country’s entire population, a sample includes all those who took part in a survey. If we analyze whether a batch of cars has defects, a sample consists of those several cars we take for an examination.
 A sample is a representative subset of a population, which consists of randomly chosen elements, image source
- A hypothesis is a claim or assumption about the population.
- A null hypothesis states the numerical assumption to be tested. An example would be: “The average height of a typical Australian man is 179cm.” For automobiles, it might be: “There are no defects in this batch of cars.”
- An alternative hypothesis is the opposite of the null hypothesis: “The average height of a typical Australian man is not 179cm,” and “This batch of cars has defects.”
A distribution is a mathematical function that assigns probabilities to possible outcomes of an experiment. The most famous distribution is called normal or Gaussian. It is widely used in natural and social sciences and has several valuable properties. The normal distribution has a bell-shaped curve shown below. It can be seen from the figure that the closer the event is to the mean, the higher is its probability. If, on the other hand, an event is far from the mean, its probability is miserable. The importance of the normal distribution is partly due to the Central Limit Theorem, which is beyond the scope of this article. Still, the main reason why normal distribution is so important is that it contains many natural phenomena. Human heights, animal population, blood pressure, students’ grades, and many other statistics can be described with Gaussian distribution.
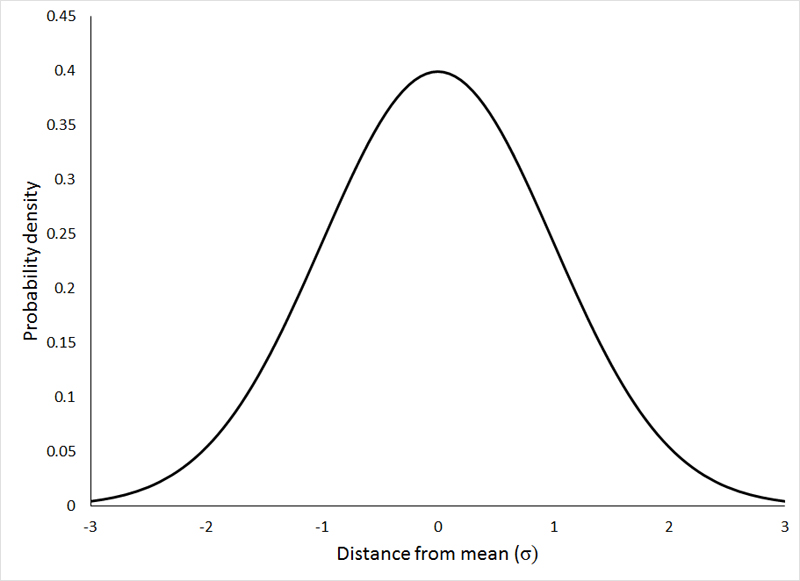 The normal distribution has a typical bell-like shape, image source
The Intuition Behind The P-value
Now that we know these terms, we can examine the question of hypothesis testing closer. Hypothesis testing is basically all about calculating how certain we are about the inference based on the sample. Let’s take an example of determining the average height of men in Australia. Naturally, it is impossible to measure every single man. So we will choose a sample: a few thousand men from all over the country. Measuring their heights gives us the result of 182cm. Does it mean that our hypothesis is wrong, and the actual average height is not 179cm? Or is this just a coincidence, and this value does not mean anything? To be honest, we can’t say for sure. What we can do is check the probability of getting such a value. Based on this probability, we can then reject or fail to reject our hypothesis.
The p-value allows us to do precisely that. Take a look at the figure below. The red point represents the value we calculated for the sample, 182cm in our case. The p-value is the probability of obtaining an outcome, at least as extreme as the observed sample value. In simple words, the p-value measures the likelihood of all the values to the right of the red point. In our case, the p-value shows the probability of getting the average height with a value higher than 182cm.
A significant p-value means that there is a high chance to get such results, i.e., there is nothing unusual in the value we received. In this case, we have no evidence against our null hypothesis.
A small p-value, on the other hand, is evidence against the null hypothesis. A small p-value implies that there is a small probability of obtaining the results we received. It is very unusual, and we can, therefore, conclude that there is something wrong with our null hypothesis.
 The p-value measures the likelihood of the values to the right of the obtained sample value, which equals the area marked by red points, image source
Level Of Significance
But how do we know whether the obtained p-value is large or small? For this, we use a level of significance. The significance level (usually denoted as α) is the probability of rejecting the null hypothesis when it is true. For example, if we choose α=5%, it implies a 5% chance that we will make a mistake and reject the null hypothesis when it is actually true. The significance level is chosen for each task individually, but if you don’t know what to start with, take α=5%. This is the conventional value that is used most often.
Take a look at the figure below. The red point represents the significance level. The orange point represents the obtained p-value. If the p-value is below the significance level (like in this figure), we reject the null hypothesis. This is because we have received a p-value small enough to say that an event is too rare to happen, considering the null hypothesis is true. On the contrary, if the p-value is above the significance level, we conclude that any difference between the sample value and the population value is totally okay.
And that’s it. Choosing the significance level and calculating the p-value is all it takes to test a hypothesis. Another question is how to calculate the p-value.
 The illustration of the relationship between the level of significance and the received sample parameter, image source
How Do We Get The P-value?
Let’s continue with the above example of measuring heights. You calculated the average height in your sample and received the value of 182cm. The next step is calculating a z-score, which is the difference between the measured sample parameter and the population parameter we are testing. The formula for calculating the z-score is:
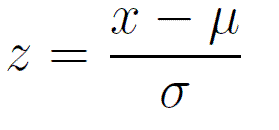 The formula for calculating the z-score, image source
Here:
- μ is the mean of the population (the value we are testing)
- x is the mean of the sample (the value we received)
- σ is the standard deviation of the population
Note: If the population’s standard deviation is unknown, sample standard deviation can be used as an estimate.
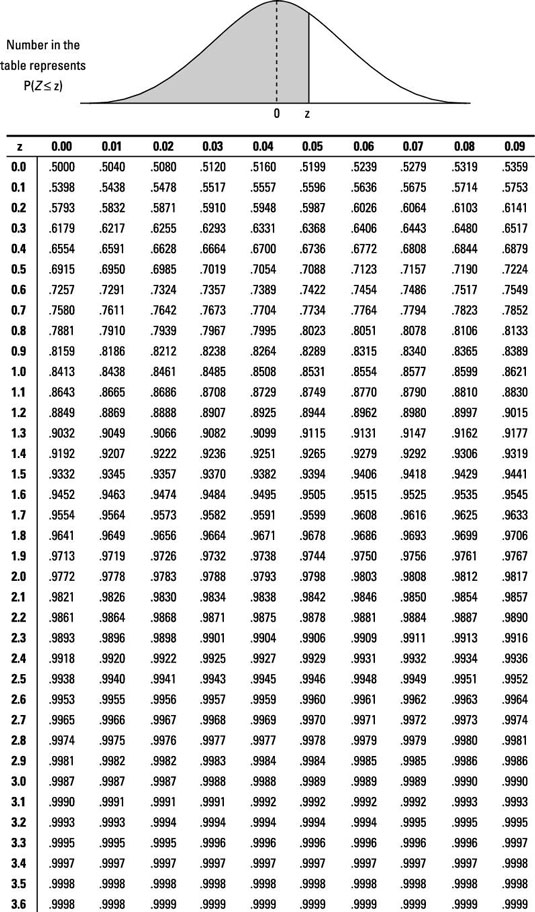
Finally, we can get the p-value. It is usually calculated using special tables, like the one presented in the figure below. This z-table shows the probability of getting the result to the left of the z-score. However, we need the probability of the correct region. Since the p-value is between 0 and 1, we can simply subtract from 1 the value obtained from the table. We now have the p-value.
Note: Human heights have a normal distribution (there are more people with a height close to the average. And there are fewer people who are very tall or very short. The more extreme the value of the height is, the fewer people have it). Because of this, we use a table for a normal distribution. For other kinds of distributions, additional tables are used.
 A z-table for normal distribution, image source
Final Steps
The final step in our hypothesis testing would be comparing the p-value with the level of significance. If the p-value is larger than the significance level, we cannot reject the null hypothesis because there is not enough evidence to do so. If, on the other hand, the level of significance exceeds the p-value, we reject the null hypothesis because the probability of getting such a result is doubtful to say that it is a coincidence.
Let us finish the example with the heights of Australian men. Our null hypothesis says that the average height equals 179cm. The average height of the sample is 182cm. We now only need the standard deviation. Again, if the population’s standard deviation is unknown, we can use the sample standard deviation as an estimate. It can be calculated using the following formula:
 The formula for calculating the standard deviation (s), image source
Here:
- x is the height of one particular man
- xis the mean of the sample (average height)
- n is the number of men in the sample
Let us suppose that, using the above formula, we got the sample standard deviation to be equal to 9cm. Substituting all the numbers into the formula of the z-score yields 182-1799 = 0.33. Looking at the z-table provided above, we find that the probability of getting 0.33 is 0.6293. That is, the probability of obtaining a score smaller than 0.33 is roughly 62.935%. But we need the probability of getting a value larger than 0.33. So, we subtract 0.6291 from one, which yields 0.3709. This means that we can get a value larger than 0.33 with a probability of 37.09%. It is quite a large number, and it is definitely larger than the 5% significance level. Therefore, we cannot reject the null hypothesis. There is simply not enough evidence to claim that the average height is not 179cm.
Note that we do not say that we accept the null hypothesis; we simply cannot reject it. There is a significant difference between these statements, and it is conventional for statisticians to talk in such a manner. The null hypothesis may be false, but we cannot confirm that with the available data.
If, on the contrary, the p-value appeared to be small, for example, 0.01, we would indeed reject the null hypothesis and say that the average height of Australian men is not 179cm.
If you find it challenging to use the provided z-table, refer to the first section of this article. Simply speaking, the first column specifies the integer and the first decimal number of the z-score, while the first row specifies the second decimal number (the one-hundredth part of the z-score). For example, if we need to find the p-value for the z-score equal to 0.34, we first look at the row that has 0.3 and then at the column with 0.04, because 0.3 + 0.04 = 0.34. Refer to the below picture for a graphical example:
 The value at the intersection of the row and column with all parts of the z-score is the p-value
Summary
Let us briefly summarize the concept of the p-value. P-value is the probability of getting the outcome of an experiment at least as extreme as the sample value. If the p-value is larger than the significance level, we cannot reject the hypothesis; if it is smaller than the significance level, we reject the hypothesis. The significance level depends on the task, but 5% is commonly used. The p-value allows us to test various assumptions with a specific level of confidence.
Overall, the concept of the hypothesis testing presented in this article is essential for any data scientist or statistician. The p-value is only one of the ways to test hypotheses, but it is the most popular and the most widely used one. We hope we helped you to build an intuition behind it. After all, the better we understand something, the better we can use it. In other articles, we will cover more statistical concepts. And for now, feel free to start using this one.