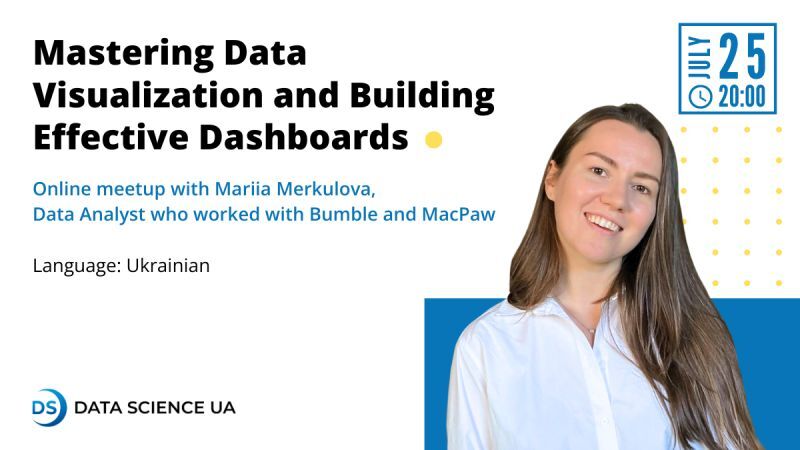
From theory to practice!
1️⃣ We’ll with tips and tricks for effective data presentation.
2️⃣ The next step is to understand the different types of dashboards and the principles of their creation. Here you will learn how to adapt dashboards to specific user needs and context.
3️⃣ And those who watch the entire meetup will learn effective strategies for improving data visualization and dashboard projects.
Meet our speaker, the one and only, Mariia Merkulova!
Data Analyst with 7 years of experience in analytics and data visualization for tech products, who worked at Bumble and on Setapp by MacPaw.
See you on July 25 at 20:00 EEST!
🔗 Registration: https://docs.google.com/forms/d/e/1FAIpQLSdsLKh0Lx3XUGkXQM59_avUzTHCsUbS_98BTaV2ELDL19llFw/viewform
