Confusion matrix
What is a confusion matrix?
A confusion matrix is a table that shows the performance of a classification model. In particular, it shows how accurately the model has defined each class and where the errors occur. In the simplest case of binary classification, a confusion matrix would look like the one in the figure below.
The rows represent actual labels; the columns represent labels predicted by the model. A perfect model would fill all the cells outside of the main diagonal with zeros, meaning that the model has classified everything correctly. But this is very unlikely.
Let us take a closer look at the matrix below. There are two labels: YES and NO. The top-left cell shows the number of data samples with the label NO that the model has classified as NO. That is, 50 points have been correctly labeled with NO. Similarly, the bottom-right cell represents those 100 points that the model has correctly labeled as YES. Other cells represent incorrectly labeled data points. For example, 5 data samples have labels YES, but the model has classified them as NO. And ten other points have been classified as YES, even though they have a label NO.
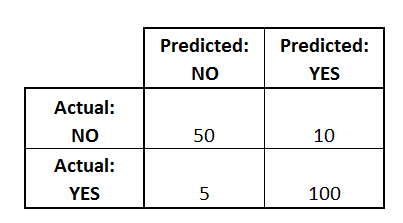 An example of a confusion matrix for binary classification (source)
Why is it important?
Confusion matrices allow us to evaluate our classification models. They are one of the most common ways to show the classification results, and, unlike simple accuracy, they are robust to problems such as unbalanced datasets. Apart from that, a confusion matrix shows where the model makes mistakes. There might be a significant difference between predicting YES when the actual label is NO and predicting NO when the true label is YES.
Think about the problem of a cancer diagnosis. If the model says that there is a malignant tumor, but there isn’t one, in reality, an additional examination will be conducted, and that’s it. On the other hand, if the model predicts no malignant tumor, and there is one, this may lead to terrible consequences. Both results are examples of incorrect predictions, but they are different. And the confusion matrix allows us to distinguish between them.